I'm

Sairul Islam

Data Analysts, Data Scientist, Data Engineer
Download CV
Play Video

Python

Project - Python

E-Commerce Data Analysis Dashboard in Python

About this project

Dataset Description
The dashboard is built on an e-commerce sales dataset containing detailed transaction information. Key fields include Order Date, Region, Category, Sub-Category, Customer Segment, Sales, and Profit. This structure enables multi-dimensional analysis by time (year, month), products (category/sub-category), and customers (segment, region). The dataset provides both revenue and profit metrics, which allow performance tracking across different business areas.
Python Dash Work Process
The dashboard was developed using Python Dash and Plotly. Data was first imported with Pandas, cleaned, and transformed into monthly and category-level aggregates. Interactive filters such as a year slider and region dropdown were implemented using Dash components (dcc.Slider, dcc.Dropdown). Visuals such as line charts, bar charts, and donut charts were created with Plotly Express (px.line, px.bar, px.pie). Dash callbacks ensure dynamic updates so that all graphs respond instantly to filter changes. Styling was applied through CSS to create a dark theme and consistent visual design.
✅ Overall Summary
This dashboard provides a comprehensive overview of sales and profit trends. It highlights monthly performance, category profitability, sub-category contributions, and customer segment insights. Managers can quickly identify growth drivers, loss-making areas, and regional differences, making it a practical tool for data-driven decision-making in e-commerce strategy.

Website

Book Recommendation System Useing Machine Learing

About this project

Work Process of the Project
1. Data Collection & Preprocessing Dataset used: Publicly available book ratings dataset (e.g., Book-Crossing or Goodreads-style data).
Fields include:
Book_Title, Author, Image_URL, Votes (number of ratings), Average_Rating, User_ID.
Preprocessing steps:
Remove duplicates and null values.
Create a pivot table: User_ID × Book_Title with ratings as values.
Machine Learning Model
Collaborative Filtering (CF):
Based on user-item interaction matrix.
Uses similarity measures like Cosine Similarity or KNN between books.
If a user likes a book, the system recommends similar books read by other users.
Popularity-based Recommender:
Top 50 books displayed (by votes + ratings).
Example: Harry Potter series dominates due to high ratings and votes.
Web Application Development
Framework: streamlight (backend).
Frontend: HTML + CSS + Bootstrap.
Steps:
User inputs a book name.
ML model fetches Top 4-5 recommended books with cover image, author.
Another page shows Top 50 books overall.
✅ Summary:
This project is a Book Recommendation System built using Machine Learning and deployed as a web application. The dataset consists of book ratings, votes, and metadata such as title, author, and cover images. To create recommendations, two approaches were combined: popularity-based filtering and collaborative filtering.
The popularity model identifies the Top 50 books by analyzing total votes and average ratings, allowing new users to immediately see trending and highly rated books (e.g., the Harry Potter series). The collaborative filtering model, on the other hand, leverages user-book interaction data. Using cosine similarity on the user-item matrix, the system recommends books similar to the one a user inputs. For instance, if the user searches for “Colony,” the model suggests related books by similar authors or genres such as Sandra Brown’s Envy and Robin Cook’s Vector.
The system is deployed using Flask, with a simple and user-friendly frontend built in HTML and CSS. Users can search for books and instantly receive tailored recommendations with images and author details. Overall, this project demonstrates the practical use of machine learning in personalized content delivery, enhancing user experience in digital libraries or online bookstores.

Website

AGRI AI: Fruits Detection

About this project

Dataset Description
The dataset combines HR data (attrition, employees) and operational performance data (delivery & preparation work). It is likely sourced from HRIS (Human Resource Information Systems), Project Management Tools, and Operational Logs.
Work Process
Data & labeling
Collect fruit images (field photos + web). Target classes: e.g., apple, banana, orange, grape, strawberry, pear…
Label with LabelImg/Roboflow → YOLO format (.txt per image: class x_center y_center width height normalized 0–1).
Split train/val/test (e.g., 70/20/10). Add augmentations (flip, HSV, mosaic, blur) to handle lighting and occlusion.
Model training (YOLOv9)
Prepare a data.yaml (paths, class names, counts).
Start from yolov9s/l pretrained weights.
Typical args: img=640, batch=16, epochs=100–300, lr=0.01, optimizer=SGD or AdamW.
Monitor mAP@0.5 / mAP@0.5:0.95, precision/recall, and loss curves; early stop on plateau.
Evaluation & export
Validate on the test set; tune conf (e.g., 0.25–0.35) and NMS IoU (0.5) for best trade-off.
Export weights to best.pt (or ONNX/TensorRT if needed).
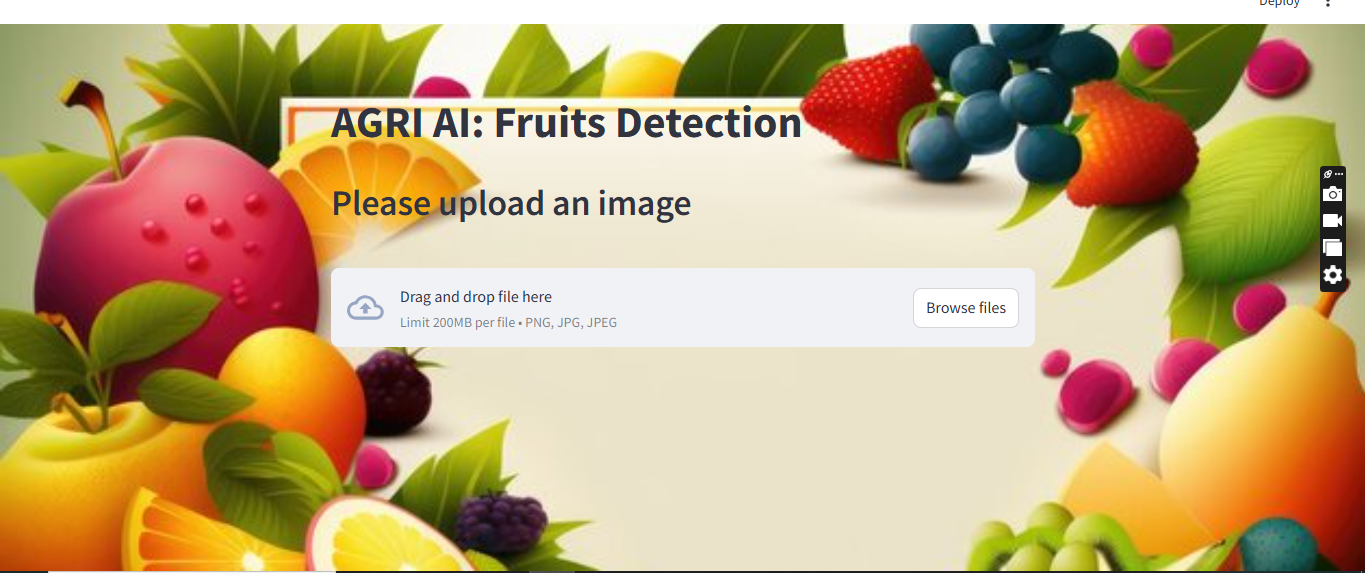
Streamlit app (backend inference)
streamlit UI: file uploader → image bytes → preprocessing.
Load best.pt once (cache). Run inference, draw boxes/labels/scores, return image.
Optional: show per-class counts, latency, confidence slider.
Folder sketch:
app.py / models/best.pt / data/ / utils/ / requirements.txt
Deployment
Local: streamlit run app.py.
Cloud: Streamlit Community Cloud / Docker on VM; set torch + opencv-python-headless deps; use CPU or CUDA.
✅ Summary:
This project builds a real-time fruit detector using YOLOv9 trained on a custom labeled dataset, wrapped in a Streamlit interface for easy image upload and visualization. The pipeline covers data curation, robust annotation, transfer-learning-based training, quantitative validation (mAP/precision/recall), and a lightweight web app for inference. Users drag-and-drop a photo and instantly see bounding boxes and class names, enabling quick quality checks or automated counting in agricultural workflows. For next steps, consider: adding more orchard conditions, model pruning/quantization for edge devices, and a batch API to process folders or video streams.

github

© Sairul Islam. All Rights Reserved. Designed by Sairul Islam